
АНАЛИЗ ПОКАЗАТЕЛЕЙ РАЗВИТИЯ СОЦИАЛЬНОЙ СФЕРЫ МАКРОРЕГИОНА (НА ПРИМЕРЕ ЦЕНТРАЛЬНОГО ФЕДЕРАЛЬНОГО ОКРУГА)
Aннотация
В статье представлены результаты анализа показателей социального развития Центрального федерального округа Российской Федерации, выявлены причины, препятствующие их росту. Целью исследования является определение тенденций развития социальной сферы Центрального федерального округа на основе оценки денежных доходов населения, уровня безработицы, ожидаемой продолжительности жизни при рождении, уровня младенческой смертности за 2005-2014 гг. Актуальность произведенного исследования объясняется повышающейся заинтересованностью реальным положением дел в Центральном федеральном округе, их инвестиционной привлекательностью, действием региональных органов власти по развитию социальной составляющей в регионах.
Ключевые слова: Центральный федеральный округ, социально-экономическое развитие региона, денежные доходы населения, уровень безработицы, ожидаемая продолжительность жизни при рождении, уровень младенческой смертности
К сожалению, текст статьи доступен только на Английском
Introduction
The Central Federal District is the main region of the country. Being in close relationship with other subjects of the Russian Federation, the Central Federal District sets the rhythm of the development of the whole Russia, but at the same time, the problem area can become a problem throughout the country.
The solution of problems of socio-economic development is a key priority which requires a coordinated policy and decision-making at the Federal level and at the level of subjects of the Russian Federation. Therefore, the aim of this study is to estimate the dynamics of indicators of social development of the Central Federal District on the basis of an assessment of monetary incomes of the population, unemployment rate, life expectancy at birth, infant mortality.
Research methods
Within the framework of the research the following methods were used: analysis and synthesis, dialectical method, economic-statistical methods, method of expert evaluations, etc. In particular, the results of the progress study were obtained using the following methods: abstraction, analysis and synthesis, induction and deduction were used to identify the problem area of research; monographs were used for the analysis of basic economic categories and provisions; the graphic used for visual presentation of results trends.
The application of these methods ensured the validity and reliability of findings.
Research results
The Central Federal District (here after – CFD) is a leader in the economy of the Russian Federation. The macro-region ranks first in the country industrial production (over 20%), funds of the economy (25%), population, agricultural production (25%), the number of scientific and technical workers (50%) [1].
Besides, the CFD has exceeded other federal districts on the development of the social infrastructure and production. These indicators are reflected as 28% of employment of the population in economy of Russia, more than 35% of the gross regional product, more than a third of industrial output.
A necessary condition of development of the Central Federal District is the public social sphere, which creates the basis for harmonious development of each resident of the district [1]. However, the events connected with the geopolitical situation in the world market exert impact on the social development of the Russian Federation, and respectively on the development of the Central Federal District.
To assess the social situation of the Central Federal District we will use the following indicators:
- the ratio of money incomes to the cost of the fixed set of consumer goods and services;
- unemployment rate;
- life expectancy at birth;
- the infant mortality rate.
By means of an indicator of cash incomes of the population we will evaluate their level of income and purchasing power. This indicator can also tell about the amount of funds remaining at the disposal of the population after purchase of goods, necessary for life [2].
The source of data on the per capita income of the population and the cost of a fixed basket of consumer goods and services is Rosstat. The kit includes 83 names of goods and services, including 30 kinds of food products, 41 species of non-food products and 12 types of services [3].
In general, in the Central Federal District, in 2005-2014 the average per capita cash incomes of the population have increased by 220%. From 2005 to 2006 a low rate of a surplus of cash incomes of the population is observed, generally in the region it has constituted 1,67%.
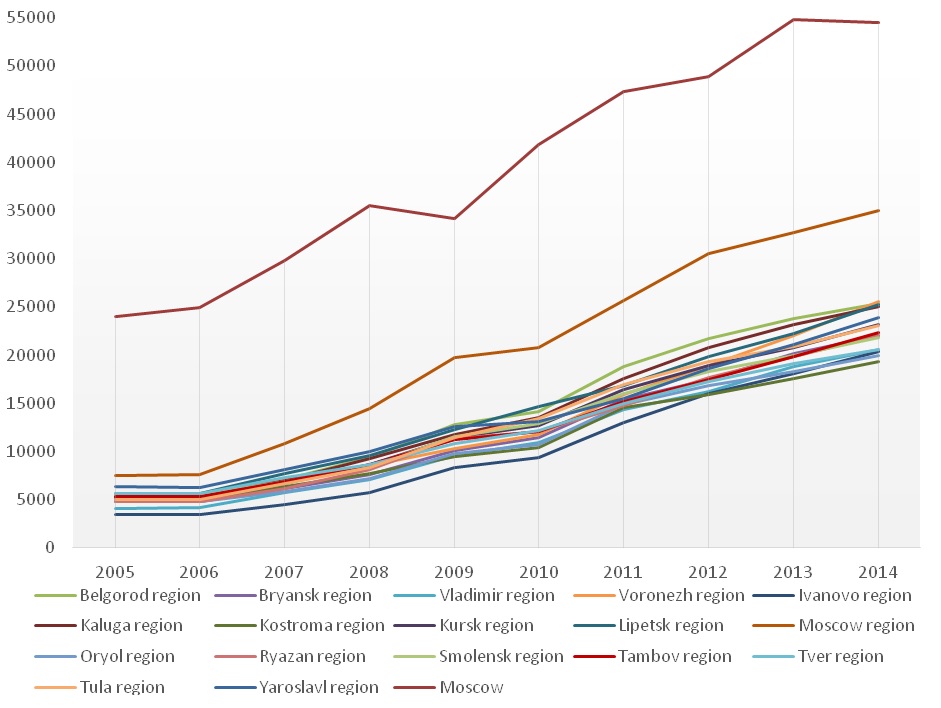
Fig.1. Dynamics of the average per capita cash income of the population of the Central Federal District in 2005-2014, rub.
Рис. 1. Динамика среднедушевых денежных доходов населения ЦФО за 2005-2014 гг., руб.
As can be seen in fig.1, the analyzed index in Moscow is several times greater than the average per capita income of other areas of the region. This difference is due to the fact that Moscow is the capital of the Russian Federation. In the city, there is the State Government, head offices of many large companies, etc.
Despite the overall positive trend, the economic crisis of 2008 significantly affected the average per capita income. Its first influence was reflected in the population of Moscow. Thus, in fig.1 a significant decrease in this indicator can be seen. And in other areas of the region the consequences of the crisis were already evident in 2009: the growth rate of income declined.
In 2014, compared to 2013, the average income increased, the growth rate was 4.5%. This indicator in 2014 decreased only in one region – in Moscow, by 0.7%. Despite this, the city of Moscow holds a leading position of the volume of income.
Besides, the most notable increase in the income is observed in Voronezh region (15,6%), in Lipetsk region (13,7%) and in Yaroslavl region (13%). An insignificant increase is observed in Moscow region (6,7%), in Belgorod region (6,9%), in Tver region (7,8%) and in Kaluga region (7,8%).
The increase in the income of the population has entailed also the increase in consumer prices. In 2005-2014, the cost of the fixed set of goods and services in the Central Federal District grew by 154,8%. The rate of a surplus of average per capita cash incomes (220%) for this period was above the rate of an increase in value of the fixed set of consumer goods and services, this fact confirms the increase of purchasing power of the population.
In 2014, in comparison with 2013, the cost of the fixed set of purchasing power in the Central Federal District increased by 20,6%.
The greatest gain is recorded by bodies of Rosstat in Kaluga region (17,5%), in Oryol region (15,6%) and in Bryansk region (14,9%). The increase in cost of a consumer basket has caused a insignificant reduction of purchasing power of the population of these regions.
The smallest gain is observed in Ryazan region (4%) and in Kursk region (4,6%). The small increase in value of a consumer basket has promoted increase in purchasing power in these regions.
Calculating the ratio of cash incomes to the cost of the fixed set of consumer goods and services for the period of 2005-2014, all the regions have values presented in table 1.
Table 1
The relation of cash incomes of the population to the cost of the fixed set of consumer goods and services in 2005-2014.
Таблица 1
Отношение денежных доходов населения к стоимости фиксированного набора потребительских товаров и услуг
за 2005-2014 гг.
Indicator / year | 2005 | 2006 | 2007 | 2008 | 2009 | 2010 | 2011 | 2012 | 2013 | 2014 |
|---|---|---|---|---|---|---|---|---|---|---|
Russian Federation including: | 1,88 | 1,65 | 1,88 | 1,99 | 2,05 | 2,10 | 2,29 | 2,52 | 2,58 | 2,54 |
Central Federal District including: | 2,35 | 2,10 | 2,38 | 2,52 | 2,41 | 2,53 | 2,68 | 2,93 | 3,01 | 2,84 |
Belgorod region | 1,39 | 1,28 | 1,52 | 1,72 | 2,06 | 2,08 | 2,39 | 2,74 | 2,71 | 2,57 |
Bryansk region | 1,36 | 1,13 | 1,34 | 1,40 | 1,61 | 1,66 | 1,90 | 2,15 | 2,27 | 2,16 |
Vladimir region | 1,13 | 0,94 | 1,13 | 1,17 | 1,38 | 1,47 | 1,66 | 1,81 | 1,93 | 1,87 |
Voronezh region | 1,38 | 1,23 | 1,40 | 1,47 | 1,44 | 1,46 | 1,74 | 2,20 | 2,40 | 2,46 |
Ivanovo region | 0,89 | 0,79 | 0,91 | 0,99 | 1,24 | 1,28 | 1,52 | 1,88 | 1,94 | 1,95 |
Kaluga region | 1,35 | 1,19 | 1,44 | 1,64 | 1,77 | 1,89 | 2,13 | 2,52 | 2,56 | 2,35 |
Kostroma region | 1,39 | 1,22 | 1,41 | 1,46 | 1,46 | 1,50 | 1,77 | 1,89 | 1,90 | 1,95 |
Kursk region | 1,30 | 1,21 | 1,38 | 1,51 | 1,70 | 1,75 | 1,90 | 2,23 | 2,31 | 2,46 |
Lipetsk region | 1,55 | 1,32 | 1,65 | 1,75 | 1,84 | 1,99 | 2,00 | 2,32 | 2,57 | 2,67 |
Moscow region | 1,63 | 1,48 | 1,90 | 2,11 | 2,51 | 2,35 | 2,59 | 3,02 | 3,02 | 2,89 |
Oryol region | 1,33 | 1,19 | 1,37 | 1,43 | 1,63
| 1,61 | 1,96 | 2,19 | 2,20 | 2,09 |
Ryazan region | 1,26 | 1,07 | 1,24 | 1,36 | 1,56 | 1,58 | 1,70 | 2,02 | 2,07 | 2,21 |
Smolensk region | 1,55 | 1,32 | 1,47 | 1,53 | 1,76 | 1,75 | 1,85 | 2,11 | 2,08 | 2,04 |
Tambov region | 1,49 | 1,32 | 1,45 | 1,58 | 1,72 | 1,65 | 1,77 | 2,03 | 2,19 | 2,27 |
Tver region | 1,40 | 1,23 | 1,39 | 1,41 | 1,54 | 1,57 | 1,70 | 1,88 | 1,92 | 1,92 |
Tula region | 1,35 | 1,20 | 1,41 | 1,50 | 1,75 | 1,84 | 2,03 | 2,32 | 2,29 | 2,25 |
Yaroslavl region | 1,61 | 1,43 | 1,66 | 1,75 | 1,88 | 1,78 | 1,79 | 2,14 | 2,24 | 2,29 |
Moscow | 3,73 | 3,41 | 3,77 | 3,97 | 3,33 | 3,66 | 3,72 | 3,73 | 3,84 | 3,49 |
Proceeding from the calculated data, it is possible to draw a conclusion that in all regions of the Central Federal District the average per capita cash incomes exceeds the cost of the fixed consumer set of goods and services, an exception is Ivanovo region till 2008.
Imagine more clearly the ratio of cash incomes to the cost of the fixed set of consumer goods and services throughout the Central Federal District for the analyzed period in fig. 2.
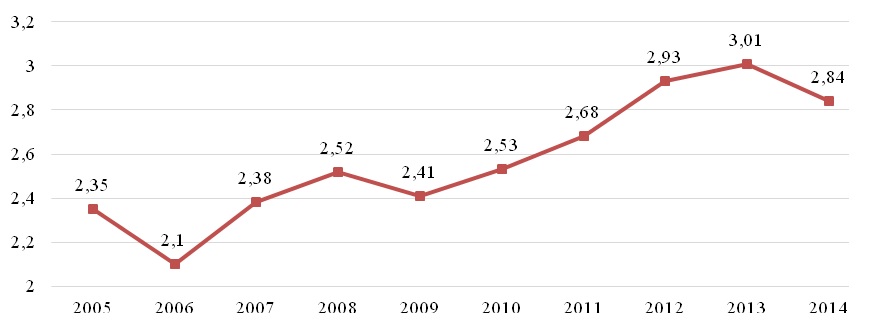
Fig.2. The relation of cash incomes of the population to the cost of the fixed set of consumer goods and services of the Central Federal District in 2005-2014.
Рис. 2. Отношение денежных доходов населения к стоимости фиксированного набора потребительских товаров и услуг ЦФО за 2005-2014 гг.
As can be seen in fig.2, 2006 has experienced a decline in the purchasing power of the population, it is due to the large rate of increase in consumer prices in the Central Federal District (13.7 %) and very low growth of incomes of the population (1.7 %). Presumably, the price increase is due to a significant decline in oil prices in August, 2006.
In 2009, the decline is due to overcoming the consequences of the Global economic crisis.
In 2014 the reduction of purchasing power of the population is also observed. Possible reasons may be: the decline in oil prices, the introduction of international sanctions against the Russian Federation.
In 2014, the leaders in the relation of cash incomes of the population to cost of the fixed set of consumer goods and services were Moscow (3,49), Moscow region (2,89), Lipetsk region (2,67), and Belgorod region (2,57). These regions took leading positions in the last ten years (during the period from 2005 to 2014).
The lowest level of this indicator in 2014 was observed in Vladimir region (1,87), in Tver region (1,92), in Ivanovo region (1,95) and in Kostroma region (1,95).
One more indicator influencing the social development of any region capable to characterize the situation in the labor market is the level of unemployment. This indicator is determined as the relation of the number of the unemployed of a certain age group to the number of workforce of the corresponding age group [3].
Let’s analyze the change in the unemployment rate in the Central Federal District for 2005-2014 in fig. 3.
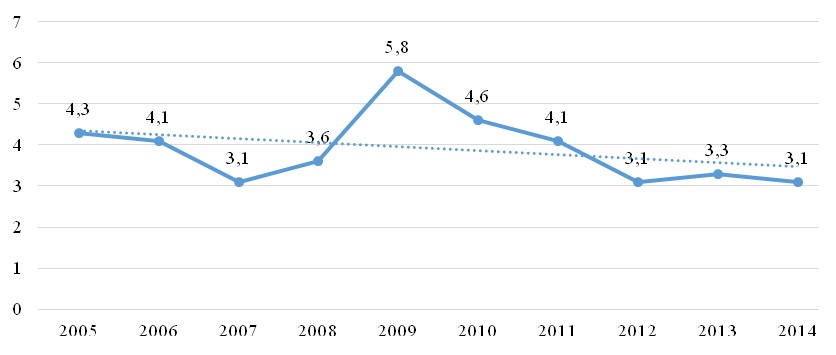
Fig.3. The change of unemployment rate in the Central Federal District in 2005-2014, %
Рис.3. Изменение уровня безработицы в ЦФО за 2005-2014 гг.,%
In fig. 3, in general, we can observe a downward tendency of the level of unemployment from 4,3% in 2005 to 3,1% in 2014. There is a sharp increase in unemployment noted in 2009 due to the Global economic crisis. Since 2010 there was resumed a positive trend for the decrease of this index by 2.7% until 2014.
Paying attention to fig. 4, it is possible to see that practically in all regions of the Central Federal District the greatest level of unemployment is noted in 2009 that is caused by closing of a large number of organizations in the conditions of the World economic crisis.
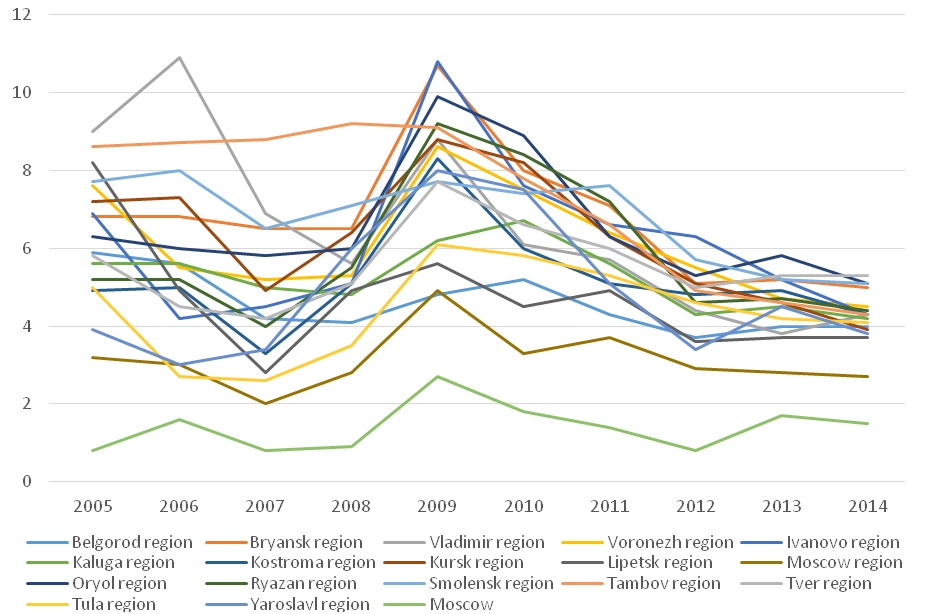
Fig.4. The change in the unemployment rate in the regions of the Central Federal District for 2005-2014
Рис. 4. Изменение показателя уровня безработицы в регионах ЦФО за 2005-2014 гг.
The lowest level of unemployment throughout the period maintained in Moscow and in Moscow region. This can be explained by the fact that the capital of the state and in neighboring regions is concentratedin a large number of head offices of large companies. In 2014, the highest unemployment rate was registered in Tver region (5,3%) [4].
Further it is necessary to characterize te quality of life, the quality of medical care, ecology, the level of social support of the population in the Central Federal District, having analysed an indicator of the expected life expectancy at birth.
The expected life expectancy at birth represents a number of years which on averagethe person should live from the generation which was born provided that throughout all life of this generation of age-specific mortality will remain at the level of that year for which the indicator is calculated [3]. The expected life expectancy is the most adequate generalizing characteristic of mortality (fig. 5).

Fig.5. The expected life expectancy at birth in the Central Federal District in 2005-2014.
Рис. 5. Ожидаемая продолжительность жизни при рождении в ЦФО за 2005-2014 гг.
In fig. 5, it is possible to see that over the last ten years the positive tendency of this indicator is observed, that allows to draw a conclusion on the improvement of the quality of life in the Central Federal District.
The indicator of life expectancy at birth of all population of the Central Federal District has grown from 59,87 to 66,58 years that is rather high compared to other regions of the Russian Federation. It can be explained by a favorable geographical position and climatic conditions of accommodation, a satisfactory condition of ecology and well developed social sphere.
Besides, the Central Federal District is located on a tectonic plate. This fact excludes a risk of earthquakes and eruptions of volcanoes. Also the region is in continent depth that gives us a temperate continental climate and doesn't allow to pass to storm whirlwinds from the ocean.
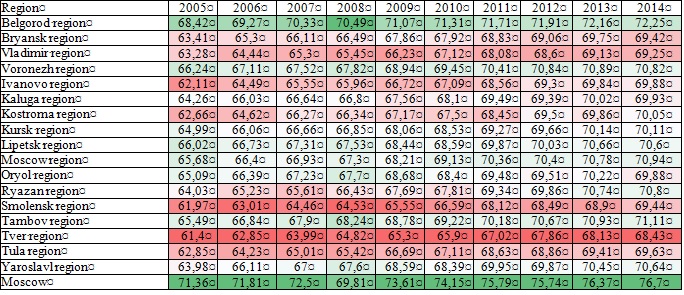
In table 2, the green color and its shades show the values for the regions with the highest life expectancy at birth, and red – the region with the lowest indicator value.
The values of the indicator in 2014 have a small dispersion of values and fluctuate from 68 to 72 years.
Table 2
The expected life expectancy at birth in the regions of the Central Federal District in 2005-2014
Таблица 2
Ожидаемая продолжительность жизни при рождении по регионам ЦФО за 2005-2014 гг.
The indicator of the level of infant mortality rate characterizes the level of health of inhabitants of the region, the quality of medical services, and general conditions of life. In the analysis, there were used the data of Rosstat on the number of deaths in children under 1 year of age, per 1,000 live births.The denominator of the indicator is the number of births. The indicator is calculated as the sum of two components, the first of which is the ratio of the number of deaths before one year from the generation born in that year, for which the coefficient is calculated over the total number of births in the same year, and the second is the ratio of the number of deaths before one year from the generation born in the previous year to the total number of births in the previous year [3].
In 2005-2014, the tendency of a decrease in infant mortality rate (fig. 6) is observed, that confirms improvement of quality of life of the population and improvement of medical technologies in the macroregion.

Fig.6. The change in the infant mortality rate in the CFD in 2005-2014, %
Рис. 6. Изменение уровня младенческой смертности в ЦФО за 2005-2014 гг., %
In 2012, there was a considerable growth of this indicator. The reason was the introduction of new live birth criteria recommended by the World Health Organization [5].
In the regions, the indicator fluctuates from 4,4 ‰ to 9,2 ‰.
Let’s analyze this indicator for the regions of the CFD, presenting the data in table 3 (for convenience the highest values of indicators for each year are marked red, and the lowest – green).
Table 3
Dynamics of infant mortality in the regions of the Central Federal District in 2005-2014, %
Таблица 3
Динамика показателя младенческой смертности в регионах ЦФО за 2005-2014 гг., %

So, according to table 3, in 2005-2014 there was a low level of infant mortality in Tambov and Belgorod regions. High rates were registered in Bryansk, Kostroma and Kursk regions.
The highest infant mortality rate in 2014 was registered in Bryansk region (9.2‰). The possible reason might be the location of the seven territories of the region in the area of radioactive contamination after the accident at the Chernobyl nuclear power plant. At the moment, in these areas radioactive pollution above normal is still registered.
The lowest indicator is observed in Tambov region (4,4 ‰). The existence of the three-level system of provision of health care to the children's population, the introduction of territorial target programs for protection of motherhood and childhood can be the cause of such good results.
Further development of the Central Federal District requires maximum resource efficiency, preservation, modernization and strengthening of innovativeness of the economy and the social sphere.
Conclusion
Thus, the socio-economic situation of the Central Federal District of the Russian Federation is quite favorable, which is manifested in a wide variety of natural resources, favorable climatic conditions for the development of agriculture and industry, the mentality of the citizens and other factors contributing to its successful prosperity.
The Central Federal District is one of the leading regions in the studied indicators of social development. The growth of social activity in 2005-2014 is evidenced by such indicators as the income per capita which is most pronounced in Moscow and Moscow region.
In all regions of the Central Federal District, the per capita income exceeds the cost of a fixed set of consumer goods and services, which also indicates the increase of income and standard of living of the population.
The indicators of life expectancy at birth, the infant mortality rate in CFD also indicates some improvement in the quality of life of the population and improvement of medical technologies in the region.
However, in order to maintain a favorable environment for living and development of the macro-region, the state and regional authorities need to raise the standard of living of the population, to create a comfortable environment for living, the successful development of human capital and an efficient economy. New methods of protection of health and education can become result of such actions that will allow to create and implement new standards of training of all levels, to satisfy needs of economy for qualified personnel.
The article was prepared within the framework of the state task of the NRU «BSU», project code № 315 «Methodologies and tools for the intensification of integration interaction of subjects of the innovation component of the economy»


Список литературы
Список использованной литературы появится позже.