
ВЛИЯНИЕ БРИКС НА КАПИТАЛИСТИЧЕСКУЮ МОДЕЛЬ ЭКОНОМИКИ
Aннотация
Данная статья исследует возрастающую роль стран БРИКС в мировом хозяйстве в течение последних пятнадцати лет. В работе рассмотрены экономический и политический аспекты новой мировой «силы» на основе статистических данных экономического роста, международной торговли, населения и зарубежных валютных резервов. Прямые иностранные инвестиции характеризуют роль и основные направления развития группы в торговле и инвестировании, позволяют установить степень участия БРИКС в процессах внутренних и внешних (со своими географическими партнерами). Статья также рассматривает вопрос возможного противодействия БРИКС глобальным мировым институтам Всемирного Банка и МВФ за счет создаваемых группой институтов регулирования, таких как Банк развития БРИКС и Резервный Фонд инфраструктурных инвестиций. В заключении представлен вывод о значительном потенциале и возможностях БРИКС, осложненных присутствием внутренних препятствий и устойчивых связей с западным миром, которые не позволяют группе завершить миссию мирового лидерства.
Ключевые слова: БРИКС, международная торговля, прямые иностранные инвестиции, многополярный мир, центр силы
К сожалению, текст статьи доступен только на Английском
Introduction. The debates about the increasing role of emerging economies become more and more popular and the most attention is given to economies of Brazil, Russia, India, China and the South Africa (BRICS) that are characterized by high growth rates for the last decade against the global crisis phenomena. These processes have caused discussions about the future dominance of the BRICS in the global economy by the GDP of growth terms and possible shift of the economic center towards the multipolar model. Emerging economies exert more and more increasing impact on the world economy. The countries of BRICS have the essential natural recourses, massive production, human and intellectual potential demonstrating growth and development during the last fifteen years. The uniting factor of BRICS is the compatibility of economies, promoting mutually advantageous synergy. Brazil specializes in production of products of agriculture, Russia - in mineral resources. India is a large supplier of highly intellectual technology, China has a strong production base, and the South Africa represents a stock of natural resources. BRICS are the five countries which are considered to be the most attractive destinations for foreign direct investment as well as, in turn, they have grown as investors in their regions during the last 15 years. The rise of the BRICS causes questions about the extent to which they influence the capitalist economies by its state-centric models of growth along with the idea of providing more development possibilities in core productive sectors of the emerging economies as an alternative path of pro-western institutions aid. Besides, BRICS play an important political role as a counterpart of US-EU-western dominance model. The key idea is that the BRICS unlike other institutes is rather focused at the conception of partnership than donor-recipient, so that they follow the process of infrastructure and energy development instead of imposing direct obligations on developing countries to follow the proposed debt program and interference. Some experts also pose questions concerning to what extent the economies of the BRICS are compared one to another and whether there are deep differences that might limit their expansion.
The purpose of the work is the estimation of the BRICS’ activity in the global economy and the assessment its influence on the world order, driven by the developed economies.
The methodology. The paper is based on the comparative analysis of the statistical date provided by the International Institutions on key development indicators: the economic growth, international trade, population, foreign direct investment and currency reserves. The current methodology allows to estimate the BRICS’ activity in key areas of global development and to compare it with the advanced indicators.
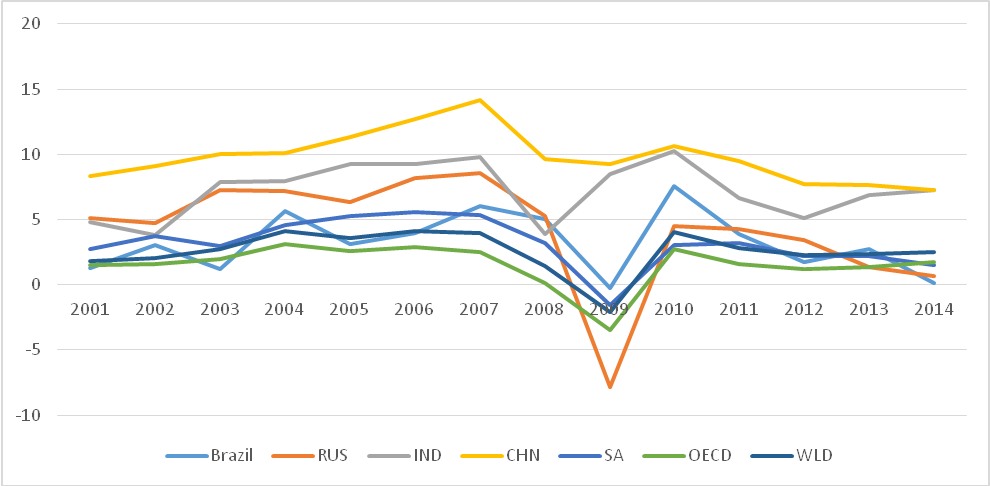
The main part. The BRICS in general have demonstrated stable and continuous growth during the last 15 years (see fig.1) and proved to be steady and to recover fast (excluding Russia) in comparison to developed economies and average world indicator.
Source: The World Bank
Fig. 1. BRICS growth rate in comparison to the world growth 2001-2014
Рис. 1. Рост БРИКС в сравнении с мировым экономическим ростом, 2001-2014
China has the highest growth rate and it is usually assessed as the most active BRICS driver. India was able to reduce their productivity gap and to recover fast throughout the period and in 2016 the forecasts estimate India soon to overcome China in terms of economic growth. On the contrary, Russia, being one of the most important contributors in BRICS has less stable fundament (see fig.1). Brazil, Russia and South Africa are three countries that have shown the lowest growth and the largest losses in manufacturing in the 1980-2013 period and have not been able to narrow the gap during the period. (Nassif A., 2015, p. 34).
To analyze the role of BRICS in the global economy the paper surveys the BRICS involvement in the international trade. Foreign direct investment (FDI) is one of the factors that affects economic growth directly, because it contributes to capital accumulation, lead to structural transformation and the transfer of new technologies. Besides, FDI attractiveness enhances the employment by labor training and skill acquisition, bringing new management practices and developing organizational arrangements.
Table 1
BRICS’ economic indicators, 2014-2015
Таблица 1
Экономические показатели БРИКС. 2014-2015
Indicator | GDP, 2014 | Export, 2014 | Import, 2014 | Population, 2015 | Currency reserves, 2014 | |||
Measure | current, $ billion US (% of BRICS) | $ billions US | % of total | $ billions US | % of total | Current millions | % of total | Millions US dollars |
Brazil | 2,346 (13,8 %) | 225, 1 | 1,1 | 239, 1 | 1,2 | 207,8 | 2,8 | 363,5 |
Russia | 1,860 (11 %) | 497, 7 | 2,6 | 308,0 | 1,6 | 143,4 | 1,9 | 386,2 |
India | 2,048 (12 %) | 321, 6 | 1,6 | 463,0 | 2,4 | 1,311 | 17,8 | 325 |
China | 10,354 (61%) | 2,342, 3 | 12,3 | 1,959,3 | 10,3 | 1,376 | 18,7 | 3,900 |
South Africa | 0,350 (2%) | 0,91 | 0,4 | 121,9 | 0,6 | 54,4 | 0,7 | 49,1 |
BRICS (% or the world total) | 16,958 (21,8% of world ) | 3,477, 8 | 18,3 | 3,091,5 | 16,2 | 3,092 | 42 | 5,053,8 |
WORLD | 77,8 | 19,003,732 | 100 | 18,987,4 | 100 | 7,350 | 100 | - |
Source: The World Bank, The UNCTAD Statistics
The share of cumulative GDP of five states in the world domestic product exceeds 21%, with the forecasted increase for the last 15 years more than by 3 times. The total volume of currency reserves of BRICS comprised 5 billion dollars, that is 4 times more than a cumulative similar indicator of the Eurozone, or ASEAN states. The territory of China, India, Brazil, Russia and the Republic of South Africa contains 42% of the world population (see Table 1).
China is considered to be the most active player and a leading driver of the economic growth in the BRICS. While the South Africa seems to stay far behind of all other members. However, there are key elements that pushed BRICS to the cooperation with Africa: the volume of trade and investment have increased significantly and fastened strong partnership between the South Africa and the private sector of the BRICS. Besides, the South Africa remains a key actor in negotiations with the rest Africa, maintaining diplomacy and its increasing political influence in the African region and promoting its interests and contributing to peacekeeping (Africa-BRICS Cooperation, 2013, p. 18-19).
Table 2
FDI inward and outward stock, 2014
Таблица 2
Внутренние и зарубежные накопления ПИИ, 2014
Country | FDI inward stock, billions | Percentage of total world, % | FDI outward stock | Percentage of total world, % |
Brazil | 754,7 | 3,0 | 316,3 | 1,2 |
Russia | 378,5 | 1,5 | 431,8 | 1,7 |
India | 252,3 | 1,0 | 129,5 | 0,5 |
China | 1,085 | 4,4 | 729,5 | 2,9 |
South Africa | 145,3 | 0,5 | 133,9 | 0,5 |
BRICS | 2,616 | 10,6 | 1741 | 7 |
WORLD | 24,626 | 100 | 24,602 | 100 |
Source: The UNCTAD statistics
The volume of inward foreign direct investments in the economies of BRICS has exceeded 2,6 trillion dollars and comprised about 10% of a world stock of FDI. At the same time the amount of outward FDI stock reached $1,7 trillions (7% of total outward FDI). The balance between the imported and exported capital characterizes BRICS as an attractive destination for international capital.
Though the South Africa has quite a little share in FDI, it is perceived to be the world’s second attractive region for foreign investment. The largest share of investment 51.8% in 2014 was attracted to the most competitive three African sectors – technology, media and telecommunication, financial services and consumer products and retail (Africa’s Attractiveness Survey, 2015, p. 5, 12). While FDI plays a vital role in Africa’s economy by building infrastructure, creating jobs, developing skills and reducing poverty, Africa becomes more and more interesting destination for capitalist economies, looking for a way to diversify their activities and to gain new profit. The EU is the most valuable trading partner for the South Africa’s economy, as it comprises a quarter of its international trade. The second largest partner is China, that amounts 12,8%, the USA presents 6,8% (The trade with the South Africa 2015, p.8).
China acts usually as the most contributing BRICS members with its manufacturing, population, international trade and the highest growth in the world. China comprises more than 40% of BRICS investment activity, concentrating mostly in manufacturing, retail trade, rent and business services. In the outflow direction services and a mining industry dominate, while the share of manufacturing industry is small. The exported Chinese capital took on the responsibility for forming of infrastructure abroad (trade, financial, serving) in pursuing the idea of export expansion of Chinese companies and for ensuring other global interests. China is the second largest trading partner in the world, it has trading relations with the majority of the developed and developing countries. The largest Chinese trade partner is the EU that comprises 14,3% of the Chinese trade. It is followed by the USA that comprises 12,8%. Japan and the South Korea shares the third place, having 7,2 and 6,8 percent relatively (International trade with China, 2015, p. 8).
Indian investment projects are focused mostly on the tertiary sector. IT, business services and financial services have the immense potential. Infrastructure is developing along with defense and aerospace manufacturing. Investors also found opportunities in automotive design, assembly and components, pharmaceuticals and food processing. India is considered to become a hub for design, innovation and manufacturing in the coming years (India’s Attractiveness Survey, 2015, p. 17). Indian companies seek to get not only access to the new markets, but also to technologies and know-how. India is transforming from job seeker into job creators by providing more than 100 million new manufacturing jobs by 2022 through the “Make in India” program that was established by the Indian government and caused the interest of BRICS members (Russia, particularly) in the participation in manufacturing projects within the program. The program is supposed to increase the bilateral trade and investments between the two countries as well as to provide benefits to other economies: Germany, Japan, the USA (Infobrics, 2015).
More than 30 percent of the investors consider India to be the most attractive financial market, and 60 percent placed the country among the top three investment destinations (India’s attractiveness Survey, 2016, p. 41) Besides, India is considered to act as a new locomotive of growth in the 2016 as the IMF forecasts Indian growth more than 7.3%. The growth was mostly caused by low prices for oil, that India has to import 80% of all its energy consumption. India was placed to the group of the most resistant emerging countries to possible debt crises (The Economist, 2015). The most important Indian trading partner is China, that consists 11% of total Indian trade, the second is the USA (9%), the United Arab Emirates took the third place and amounted to 7,7% of total international trade in India (India’s department of commerce, 2016).
Brazil’s economy is specialized mostly in manufacturing exports, industrial commodities and import of natural resources-based goods. FDI is concentrated in manufacturing and services sectors. The motor vehicle industry saw the strongest rise in 2014, placing this industry among the four largest investment recipients after receiving $6.8 billion in commerce, $4.2 billion in telecommunications, and more than four billion in oil and gas extraction. Brazil is forecasted to be one of the top host economies in 2015-17 (World Investment Report, 2015, p. 60, 26). The country maintains key trade relations with the EU, that comprises 19,6% of total international trade, China is stays not far with 17,1 %, the USA took the third position and amounted 13,8% of Brazilian international trade, and Argentina has 6,3% (International Trade with Brazil. 2015, p. 8).
Russian investment in general has a manufacturing character with the oil and gas dominance. Having a strong industrial orientation Russia keeps very closed relations with China in BRICS. However, a great number of military and defense projects with Brazil, aerospace and technological projects with India make Russia the key player in the BRICS. The largest Russian trading partner in 2014 remains the EU, that covers nearly a half of Russian trade (48,2%), then comes China – 11,3%, and Turkey and Belarus share the third place, comprising both 4%. (International trade with Russia, 2015, p. 8).
The investment activity of BRICS in developed economies is the main indicator of the impact of BRICS on capitalist world. The American report on Foreign direct investment assumes that BRICS’ combined investment remains small in the U.S. Even as the BRICS invest more, their total investment in the United States comprised just 1.5 % of all foreign investment in 2013. (FDI in the U.S. Report, 2016 p. 6). Japan, one of the world largest economies reported that the share of BRICS stocks in Japan comprised 0,58% of the total FDI stocks in 2014, and the largest contributor was China (Japanese trade and Investment statistics, 2016). One of the most important BRICS investment partners in the capitalist world is the European Union. At 2012, 14 percent of total European outward stocks were located in the BRICS countries, the third of them were settled in China and other third - in Brazil. Russia and China remain the most important donors and recipients in the EU investment (Foreign direct investment between the European Union and BRIC, 2014). China undoubtedly leads BRICS countries, announcing more than 300 FDI projects in Europe and amounting to 8 per cent of Europe’s FDI (European attractiveness survey, 2015, p. 22). Russian investment in the EU is focused mostly on Cyprus, Netherlands and Luxemburg, that is considered to be a low-tax zones, so that the money does not contribute the infrastructure projects and economic growth but only flows in and out the European Union.
Every member of BRICS keeps very strong relations with their old trading partners like the European Union or the United States, while the internal BRICS cooperation remains low. The share of mutual investment within the group does not exceed one percent, the majority of large infrastructure projects are still not implemented because of internal obstacles, arising while developing the idea. The value of BRICS trade was estimated $6,5 trillion US in 2014 (see table 1), nevertheless, the main trading partners are not the development world as the BRICS’ first goal proclaims, but the western side - against who the group has been actually created. Mutual BRICS trade is less than 320 billion dollars a year, while their trade with the US and EU is six times higher (Movchan A., 2015). While the potential is extremely high and the forecasts are promising, the reality is different. In economical terms, the BRICS as a whole do not have such a significant impact on the global capitalist economy, because every single member acts on its own. The statistics prove, that even though the BRICS are the richest in resources and fast in growth, the cumulative effect has not been reached yet, and every country is rather focused on already excising strong relations with old partners instead of facing obstacles with new ones.
The World Economic Forum highlights some key factors that limit the impact of BRICS on the global economy. First, the Chinese dominance plays as an overbalancing factor in BRICS and makes the relation character rather Chinese-oriented. Second, the BRICS have some similar features in economic indicators, but the history and phases of economic development and the human development (in terms of poverty and health, for example) and thus, ideologies are extremely different so that they nearly do not have mutual economic interest and remain heavily integrated into trade and relations with their key western partners. Third, instead of cooperating, the BRICS compete with one another. China, India and Brazil are competing in the clothing area, also they have interests in the African region, where they have to deal with the South Africa. The international aircraft and military markets are divided between China, Russia and Brazil. The higher the market pressure and the competition the less mutual interests the BRICS have and less impact on the global economy they provide.
In political terms, BRICS performance is often estimated as an economic alliance posing a challenge to the western world, a new network built by rejection of the neoliberal model. BRICS got extremely enthusiastic recognition from the developing world suffered from the western (specifically, American) old hegemony, disproportionate ranking in international institutes and inability to influence on the world economy. Two key institutions a Contingency Reserve Arrangement and the New Development Bank of BRICS are supposed to create a counterweight to the World Bank and the IMF (Piper L., 2015, p. 16). The main idea of two institutes focuses on providing financial help to developing countries and to implement infrastructure projects. India has already declared its intention to receive a financing for its government program “Make in India” but the fruits of the program as well as the BRICS’ impact on it can be estimated only in the future.
Within the idea of global leadership, integration remains one of the key points of BRICS summits (Bello W., 2014). However, the result and the success of integration will be probably limited due to the high inequality of societies as well as the absence of such a key factor of integration as geographical proximity. The BRICS role as the new “economic power” should not be overestimated. We can see the great potential, however, the common performance remains low. After the Summit and the Bank establishment nothing significant had been undertaken in the development path. Some think BRICS is nothing that a loud acronym promising a lot, but doing less to move to the chosen direction.
Moreover, as it has been stated above, China is the main driver of common BRICS growth, comprising more than 60 percent of its GDP and being the main contributor in trade and investment. At present, the economic society is worried about China’s slowing down. It shortened its growth at 7% - the slowest expansion during the last two decades. It can have a damaging effect on further BRICS performance and to weaken the position of the group in the world. First, Russia suffers a difficult time and needs a healthy supply of oil to China, which was even worsened by the oil price fall. The decline in consumption of steel in China could hit Brazil's export of iron ore. The effect on India can arise on India’s export of cotton, copper and iron & steel. China's downturn may also result in lower sales of jewelry, that directly affects the South African export of diamonds, gold and platinum (Ralhan S.C., 2015).
Conclusion. The analysis of economic performance of BRICS showed that the group had been demonstrating an impressive growth during the last fifteen years as well as a significant rise both in trade and investments, countries have also achieved an essential share of FDI in total world stocks during the last 15 years. In general, the BRICS were estimated as the most attractive economies for foreign direct investments and projects. However, it is still difficult to asses whether the improvements and rise in India, Africa or Brasilia were caused by joining BRICS or they could have managed the results even without a status of a BRICS member.
While the estimations and forecasts seem to be prosperous, the real impact of BRICS on other capitalist economies is not so remarkable yet. Countries keep developing trade and investment with their main counterparts – the United States and the European Union. The developing countries represent the small share of BRICS relations and this cooperation exists mostly within the regional connections. The internal cooperation within BRICS remains low and leads to nothing but annual meetings. In political terms, the importance of BRICS should not be overestimated until its recent implications like the Bank of BRICS or the Contingency Reserve Arrangement have not proven yet the impact on the developing countries and a real threat to the western policy. The World Bank or the IMF have gained the authority, to a certain extent, insufficient, but still stable and ancient. As for BRICS, we can only rely on the forecasts and promises, that proclaim them to be a new locomotive of a multipolar world with a diverse centrism.


Список литературы