
SECTORAL IMBALANCES OF INDUSTRIAL DEVELOPMENT: A COMPREHENSIVE ANALYSIS AND AN ECONOMETRIC APPROACH
Abstract
The article is devoted to the urgent problem of the sustainable development of the industrial potential of the regions in Russia in the context of structural transformations and external challenges. Using the example of the Orenburg region, the patterns and imbalances of industrial development are studied, which are important for the formation of a scientifically sound regional economic policy. The relevance is due to the need to develop differentiated approaches to managing the industrial complex of the region, taking into account the specifics of individual types of economic activity. A comprehensive analysis of the dynamics of the volume of shipments of goods of our own production in the Orenburg region for the period 2020-2023 by main types of economic activity was carried out. The study revealed a steady trend towards strengthening the sectoral diversification of the region's industrial complex. The application of polynomial trends demonstrated the multidirectional dynamics of the development of individual sectors of the economy. The developed multifactorial regression models for each type of activity revealed the differentiated influence of key factors of production. Based on the analysis, practical recommendations are proposed for the region's governing bodies, including the development of a differentiated sectoral policy, stimulating investment in the most effective areas, developing special programs to support problem sectors and creating a monitoring system based on the developed models. The behavioral research provides a scientific basis for making managerial decisions and developing a medium-term strategy for the industrial development of the Orenburg region.
Keywords: industrial production, regression models, investment efficiency, economic development of the market
Introduction
The territory of the Orenburg region, covering 124.0 thousand km2 (which is 0.7% of the area of Russia), has a unique physical and geographical location: it includes the southeastern and part of the East European Plain, the extreme south of the Ural Mountains and areas of the southern Urals. The maximum length of the region from west to east is 755 km, and from north to south – 425 km. The perimeter of its borders is 3,700 km. The internal Russian borders of the region are distributed as follows: the western border is entirely on the border with the Samara region; the northwestern border is entirely on the border with Tatarstan; and most of the northern border (from the Caucasus to the Urals) is on the border with Bashkortostan. In the northeast, the Orenburg region borders the Chelyabinsk region. The total length of the international border is 1,670 km. It runs along the eastern and southern borders of three Kazakhstani regions: Kostanay, Aktobe and West Kazakhstan. The region's current borders were officially approved on 7 December 1934 (Shavrina, Yu. O., 2023).
The industrial history of the Orenburg region dates back to the XVIII-XIX centuries, as evidenced by a number of the oldest enterprises of the XX century, such as CJSC Khleboprodukt-1, -2, JSC Orenburg Feed Mill, LLC Russol, PJSC Orsknefteorgsintez and JSC CompositGroup. However, until 1917, the region was one of the least industrially developed in the country, with an industry share of only three percent of the total production of the province on the eve of the First World War, dominated by the milling industry and amounted to 68%. In the following years, the Orenburg Region made a significant leap, transforming from a predominantly agricultural region into an industrial-agricultural one. The history of industrial oil development in the area between the Volga and the Urals, including the Buguruslan region, began in July 1937 with the extraction of the first five tonnes of oil. However, oil had been known to release to the surface for a long time. Favorable prospects and the need for operational development of deposits led to the creation of the Orneburgneft association in 1963. The production of one hundred million ton on March 20, 1976 in the Buguruslan district became a significant event. In 1966, the unique Orenburg gas condensate field with huge reserves was discovered, which served as the basis for the construction of the Orenburg Gas Processing Plant. The launch of its first stage in 1971 made it possible by 1975 to produce 17.4% of the country's natural gas by 1975. At the same time, in the 1960s, growing industrial plans (the Buruktsky Nickel Plant, the Gaisky GOK, and the expansion of the Orsk enterprises) in the east of the region required a powerful source of electricity (in November 1970, the first unit of the Iriklinskaya GRES with a capacity of MW was commissioned [Koshkina E.N., 2024].
The issues of determining the factors affecting the volume of shipments of industrial goods by type of economic activity, as well as the problems of industrial production, were addressed by a domestic scholar Shavrina Yu. O. [Shavrina, Yu.O., 2023]. Other researchers who have addressed these issues include Koshkina E. N. [Koshkina E.N., 2024], Lapaeva M. G. [Lapaeva M.G., 2024], Larina T. N. [Larina T.N., 2024], Shestakova E. V. [Shestakova E.V., 2023], Groen V. D. [Grun V.D., 2024], Makarov M. A. [Makarov M.A., 2025], Kuznetsova A. I., Novikov M. A. [Kuznetsova A.I., Novikov M.A., 2013], Berdin A. Yu. [Berdin A.Yu., 2011], Kabachevskaya E. A. [Kabachevskaya E.A., 2019], so do foreign scientists Hajar El Mouttaqui, Kimberly Gleason, Pornsit Jiraporn, Feras M. Salama [Hajar El Mouttaqui et al., 2024], Zhengtao Cheng, Yong Ding, Ding Xiong [Zhengtao C., Yong D., Ding X., 2025], Guzhev DA, Sintsova EA. [Guzhev D.A., Sintsova E.A., 2023], Tarifa Almulhim, Mohammed Al Yousif [Tarifa A., Mohammed A.Y., 2023], Tamošiūnienė, Rima & Petravičius, Tomas [Tamošiūnienė R. & Petravičius T., 2006], Vikrant Shirodkar, Namita Shete [Shirodkar V., Shete N., 2021].
Shavrina Yu.G.'s research substantiates the modern trend of disclosing the content of financial stability and performs financial stability diagnostics using MDA models and rating assessment models of financial condition [Shavrina Yu.O., 2023]. Larina T.N. in her article identifies the key factors of economic development, without which it is impossible to achieve technological sovereignty of Russia. It is impossible to introduce innovations without investments, while the activation of innovation processes increases the efficiency of using investment resources [Larina T.N., 2024]. Researchers E.V. Shestakova and others identify the problems and prospects for the development of industrial enterprises in the region and identify the factors influencing the development of the industrial potential of the Orenburg region [Shestakova E.V., 2023]. Kabachevskaya E. A. and co-authors in their scientific article examined the functioning of the industrial sector of the Krasnodar Territory as a potential for economic and social growth, a generative force that serves to strengthen economic positions and increase competitive advantages [Kabachevskaya E.A., 2019].
Moshirian F. is a foreign author who has conducted research in the field of investment efficiency and innovation. They analysed the impact of capital market liberalisation on innovation, including the effects of easing financial constraints and improving governance [Zhengtao C., Yong D., Ding X., 2025]. Aibai et al. studied the impact of the openness of capital software markets on ESG indicators (environmental, social and managerial impact) through the improvement of the information environment. Tarifa Almulhim and Mohammed Al Yousif investigated potential future scenarios for investments in renewable energy sources and evaluation criteria that influence the choice of the optimal scenario [Tarifa A., Mohammed A.Y., 2023].
Over the past 65 years, the industry in the Orenburg region has changed significantly, as reflected in the transformation of the production structure. While mechanical engineering, metalworking, light and food industries were the leaders in the Soviet period (1960-1970), the fuel industry had strengthened by the end of the 20th century (1980-1990). Currently, the commodity sector plays a dominant role. Changes have also occurred in the official classification of the industry by economic activity type. Since 2005, the three main areas have been mining, manufacturing, production and distribution of electricity, gas, and water, and since 2017, separate categories have been allocated for electricity, gas, and steam supply, as well as for water supply. water disposal and waste disposal [Grun V.D., 2024].
Over the 15-year period (2010-2024), the volume of industrial production showed a predominantly positive trend, significantly increasing compared to the initial level. This growth was driven by the development of the raw materials sector, that is, the main contribution was made by oil and gas production, hydrocarbon processing and the metallurgical industry, which took advantage of the favorable global price environment for a significant part of this period, attracting investments in modernizing existing and creating new industries, and (partially) diversifying, that is, the development of manufacturing industries, machine building and the agro-industrial complex. However, the dynamics were not linear, they were interrupted by periods of slowdown and recession caused by global economic crises, 2008-2009, 2014-2016, 2020, fluctuations in commodity prices and changes in the geopolitical situation, which required adaptation and the search for new sales markets and logistics chains [Lapaeva M.G., 2024; Grun V.D., 2024].
Materials and research methods
The methodological basis of the research includes the use of modern econometric methods: time series analysis, construction of second-order polynomial trends, multifactorial regression analysis.
The following methods were used during the research: analytical, abstract-logical, functional-systemic and monographic approaches, as well as expert analysis. The materials used for the article included official websites, scientific publications by domestic and foreign scientists, and statistical data from the state statistics service. The article employed theoretical, statistical, econometric and abstract-logical methods, as well as utilising internet and electronic resources. Information from the official database of the Federal State Statistics Service of the territorial body of Rosstat for the Orenburg region was used.
Results
The results of recent years indicate a stabilization of the economic situation in the region. Noticeable positive results have been achieved in almost all areas, which will make it possible to maintain industrial production at a high level relative to the beginning of the period, despite current challenges.
The volume of goods shipped, works performed and services provided by our own production and service forces for the actual types of activities – mining, processing, and the production and distribution of electricity, gas, and water across a full range of producer organisations – amounted to 2.4 trillion rubles at current prices in 2024. This reflects the sustainable functioning of key sectors of the region's economy, primarily enterprises in the oil and gas and metallurgy industries, as well as the impact of inflationary processes. Despite the continuing external challenges, the Orenburg region's industry demonstrates the ability to adapt and maintain a high level of production, focusing on domestic demand and reconfiguring logistics chains, although the real growth rate may adjust depending on global commodity prices and the macroeconomic situation. Table 1 shows the dynamics of economic activity indicators of the main industrial categories in the Orenburg region for 2020-2023 [Makarov M.A., 2025].
Таблица 1
Динамика показателей экономической активности в Оренбургской области за 2020-2023 годы, млн рублей
Table 1
Dynamics of economic activity indicators in the Orenburg region for 2020-2023, million rubles
Own-made goods, completed works and services by own forces by type of economic activity | 2020 year | Growth rates of 2019 to 2020, % | 2021 year | Growth rates of 2020 to 2021, % | 2022 year | Growth rates of 2021 to 2022, % | 2023 year | Growth rates of 2022 to 2023, % |
Mining operations | 483119,2 | 81,9 | 774984,1 | 160,4 | 788967,7 | 101,8 | 859095,1 | 108,9 |
Manufacturing industries | 317057,1 | 97,3 | 430688,2 | 135,8 | 489808,4 | 113,7 | 546872,4 | 111,7 |
Provision of electric energy, gas and steam; air conditioning | 65506,5 | 97,3 | 71346,6 | 108,9 | 84059,9 | 117,8 | 93649,6 | 111,4 |
Water supply; sanitation, waste collection and disposal, pollution control activities | 22474,5 | 109,4 | 34014,7 | 151,3 | 29779,1 | 87,5 | 28101,1 | 94,4 |
Source: compiled by authors
The presented table reflects the dynamics of the volume of shipments of goods of our own production, completed works and services by our own forces by types of economic activity in key sectors of the Orenburg region. During the analyzed period, there has been a steady nominal increase in shipments in all sectors represented, with the exception of the water supply and waste disposal sectors. The total volume in the four sectors increased from 888157.3 million rubles in 2020 to 1527817.2 million rubles in 2023, which indicates the positive dynamics of the industrial development of the complex as a whole.
Mining demonstrates the highest absolute data values and significant growth. From 2020 to 2023, the volume of shipments increased by 375,975.9 million rubles (a 77.8% increase), with the sharpest rise occurring in 2021 (+60.4% compared to 2020). This is likely due to the recovery of demand and prices for raw materials on world markets following the 2020 crisis. In subsequent years, it stabilized, maintaining a positive trend of +8.9 in 2023 compared to the level of 2022. Manufacturing industries have shown stable and steady growth throughout this period. The volume of shipments increased by 229815.3 million rubles (+72.5%). The growth rates each year show 2021/2020 +35.8%, 2222/2021 +13.7% and 2023/2022 +11.6%. This indicates the progressive development of processing capacities, possibly related to the processes of import substitution and the growth of domestic demand. The provision of electric energy, gas and steam shows moderate but steady growth. The indicator has increased by 28.2% in four years. The inertial dynamics reflect a gradual increase in energy consumption from other industries in the Orenburg region. Annual growth rates are typically in the range of 5-10%. The sector of water supply, sanitation and waste disposal demonstrates the least stable dynamics. Following a sharp increase of 51.3% in 2021, there has been a consistent decline in 2022 and 2023. By 2023, the volume of shipments decreased by 17.4% compared to the peak value of 2021 and amounted to 28101 million rubles. This negative trend may be due to a reduction in funding in this area.
To move on to assessing the real dynamics of production, it is necessary to consider industrial production indices, which reflect changes in the physical volume of products at comparable prices (Figure 1).
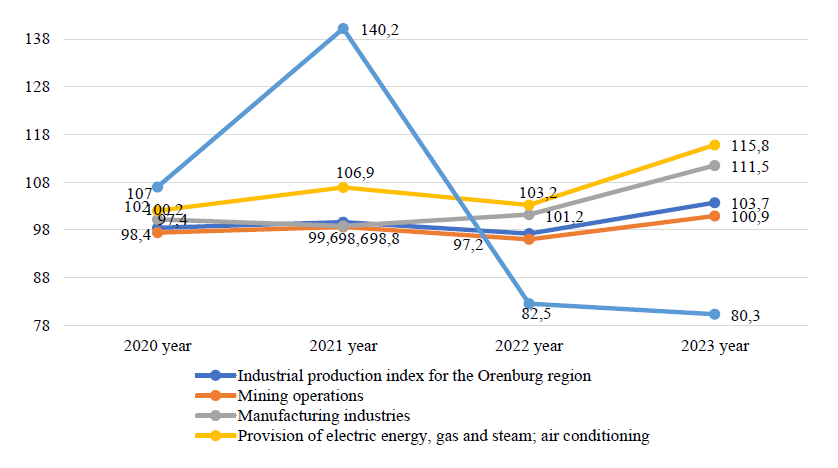
Рис. 1. Индексы промышленного производства за 2020-2023 годы
Fig. 1. Industrial production indices for 2020-2023
An analysis of the dynamics of industrial production indices in the context of the main types of economic activity in the Orenburg region shows that during the analyzed period there has been an unstable dynamic of the overall industrial production index. Following a decline between 2020 and 2022 (98.4%, 99.6% and 97.2% respectively), there was an increase to 103.7% in 2023. This recovery trend indicates the industrial sector's recovery after a period of stagnation. The mining index shows pronounced negative dynamics in 2022 (96%), followed by a recovery to 100.9% in 2023, suggesting an unstable trend. The manufacturing indices show the most stable positive dynamics among all sectors. After a slight decrease to 98.8% in 2021, there was a moderate increase to 101.1% in 2022, followed by a significant acceleration to 111.5% in 2023. The trend is now one of steady growth. The energy sector index shows sustainable development and indicates the growing electricity consumption from other industries and the population. The trend is one of stable growth. As for water supply and waste disposal, there is an extremely unstable trend with a sharp increase in 2021 (140.2%) and a subsequent significant decline in 2022-2023 (82.5% and 80.3%, respectively). It's a crisis trend. The analysis of the dynamics of industrial production indices revealed the multidirectional dynamics of industrial development in the Orenburg region.
Discussion
The aim is to analyse the dynamics of shipment volumes by type of economic activity for the period 2020–2023. In the Orenburg region, a quadratic polynomial trend was constructed for each data category (Figure 2).
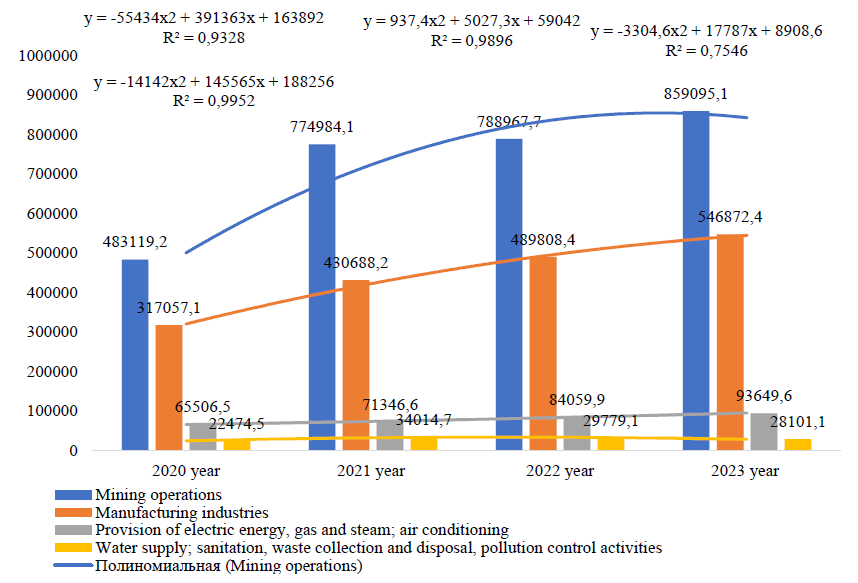
Рис. 2. Динамика объемов перевозок по видам экономической деятельности
в Оренбургской области в 2020-2023 годах.
Fig.2. Dynamics of shipment volumes by type of economic activity in 2020-2023 Orenburg region
Figure 2 shows that the mining industry is showing the steepest upward trend (+125.3 billion rubles/year), significantly outpacing other industries. The manufacturing industries have a steady positive trend (+76.5 billion rubles/year). The energy sector shows stable but more moderate growth (+9.4 billion rubles/year). Water supply and waste disposal is the only sector with a negative trend (–,2.1 billion rubles/year).
Analyzing the model of the mining category, it can be noted unequivocally that it shows a very high approximation accuracy (R2=0.933 is the coefficient of determination). The model describes a curved trend with a single extreme, which explains 93.28% of the variance in production volume, while only 6.72% of the changes are due to random factors not taken into account in the model.
The trend reflects rapid growth in 2021, followed by a slowdown and a slight decrease in growth rates. After this period, the model predicts a gradual reduction in mining volumes, not just a decrease in growth rates, which indicates the potential need to review the long-term mining strategy in the Orenburg region.
The manufacturing category indicates stable development and demonstrates steady growth with a gradual slowdown, however, the nature of the quadratic dependence with a negative coefficient indicates an approach to the saturation point or maximum value in the forecast period. The exceptionally high accuracy of R2=0.995 confirms the adequacy of the model and allows us to interpret current and predict short-term trends with a high degree of reliability. The model for the category of providing electric energy, gas and steam, as well as air conditioning, describes the data very accurately. The trend shows growth for the infrastructure industry, with a slight acceleration in recent years, due to an increase in electricity consumption and tariffs. The high coefficient of determination confirms that this quadratic model describes observations with 99.2% confidence, which indicates a strong and direct relationship between the time factor and the target indicator. A negative coefficient with a quadratic term predicts that the growth rate will gradually decrease, approaching a peak value, after which a phase of stagnation or even a moderate decline will begin.
The category of water supply, sanitation, waste collection and disposal, pollution control activities shows that the accuracy of the model is good, but lower than that of other categories. The trend indicates growth in 2021 followed by a decline, which requires special attention, since after the peak, the sector may face the need to review strategies and search for new areas of development. If the trend continues, this category of industry will suffer a reduction in the volume of work, and as a result, jobs. Predicting, we can say that moderate growth is expected with possible stagnation. In the medium term, the industrial sector of the Orenburg region may stabilize at a low growth rate, approximately 0.5-1.5% per year, depending on the global commodity markets and the implementation of new investment projects. The overall trend can be described as cautiously optimistic with a pronounced industry differentiation (Table 2).
Таблица 2
Развитие экономических категорий отраслей по видам экономической деятельности в Оренбургской области
Table 2
Development of economic categories of industry by type of economic activity in the Orenburg region
Own-made goods, completed works and services by own forces by type of economic activity | The trend equation, the value of the approximation reliability | The expected trend | Future period |
Mining operations | y = -55434x2 + 391363x + 163892 R² = 0,9328 | Weakly positive / Stagnation | -05 -1,5% |
Manufacturing industries | y = -14142x2 + 145565x + 188256 R² = 0,9952 | Steady growth | >5% |
Provision of electric energy, gas and steam; air conditioning | y = 937,4x2 + 5027,3x + 59042 R² = 0,9896 | Stabilization, weak growth | -1 -3% |
Water supply; sanitation, waste collection and disposal, pollution control activities | y = -3304,6x2 + 17787x + 8908,6 R² = 0,7546 | Low-level recession/Stabilization | - (-3%) – 0% |
Thus, the trend will go towards a further increase in the imbalances in favor of the manufacturing industry against the background of stagnation or moderate growth in mining and energy and continued problems in the utilities sector.
Trend analysis will allow us to move on to the construction of multifactorial regression models, i.e. it is a transition from describing the situation to a more in-depth analysis and management, which will allow us to identify the imbalances in favor of the manufacturing industry and understand the leverage for sustainable and balanced industrial development in the Orenburg region.
A model for the type of mining activity, where the dependent variable is the volume of shipments of goods (million rubles), the independent variables are (1 – investments in fixed assets in mining, million rubles), since mining is a capital–intensive industry, productivity (2 – the volume of shipments per person employed in mining, million rubles/person), which reflects technological efficiency and innovation (3 is the share of organizations that implemented technological innovations from the total number of organizations in production:
The regression model has a high explanatory power for analysing the volume of shipments in the extractive sector. All included independent variables have a statically significant positive effect on the performance indicator, which corresponds to economic theory and practice. An increase in investments of 1 million rubles leads to an increase in shipments by an average of 0.85 million rubles. All other things being equal, this indicates a moderate efficiency of investment with a relatively high payback, typical for capital-intensive extractive industries. The most significant factor is labor productivity, where its growth by 1 million rubles gives an increase of 1.2 million rubles, which indicates that there is a significant reserve for optimizing labor resources. An increase in innovatively active enterprises by 1% will lead to an increase of 5 million rubles, confirming the high return on technological modernization.
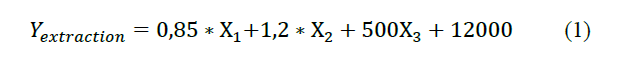
Figure 3 shows the factors of investment efficiency, where achieving design capacity on time and ensuring stable production volumes is of key importance.
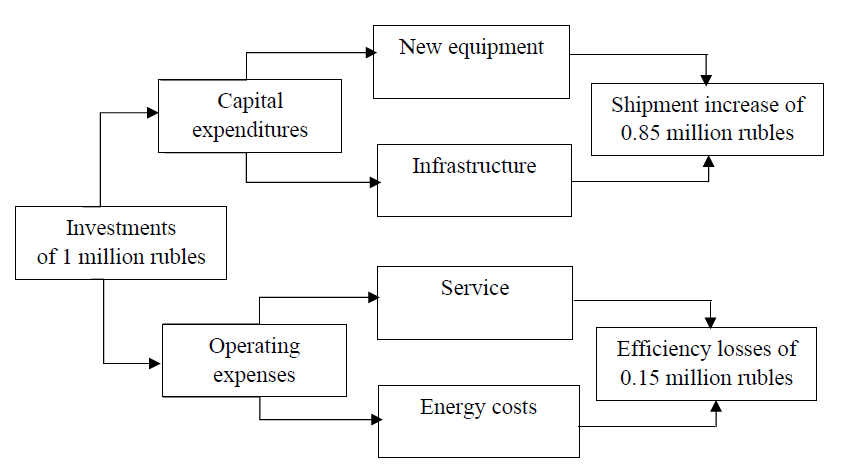
Рис. 3. Распределение инвестиций в добывающей промышленности (разработано автором)
Fig. 3. Distribution of investments in the extractive industry (developed by the author)
The mechanism of transformation of investments into the final economic result is divided into two main areas – capital expenditures directed to new equipment and infrastructure, which directly contributes to the increase in shipments, and operating costs that go to maintenance and energy needs, creating efficiency losses [Makarov M.A., 2025].
The regression model for the type of activity manufacturing has the following form:

In this case, the model interprets an increase in labor productivity by 1 million rubles/person It gives the largest increase in shipments by +2.1 million rubles, which emphasizes the importance of intensive growth factors and also shows a significant reserve for optimizing the use of labor resources, high returns from staff development activities and significant potential for technological modernization of production processes.
Each additional ruble of investment generates 65 kopecks of the increase in shipments, the relatively low efficiency of capital investments indicates the presence of significant irrational investments, a high degree of physical and moral depreciation of fixed assets and insufficient selectivity of the company's investment policy.
Innovation activity is the least significant factor, which is caused by the time lag between investments in innovations and their commercialization, high risks of innovation projects and insufficient efficiency of innovation process management.
In the presented economic and mathematical model, three key factors that determine the volume of shipments in the manufacturing industry were included as explanatory variables: labor productivity, investments in fixed assets, and innovation activity [Guzhev D.A., Sintsova E.A., 2023]. The methodological basis of the model is based on a derivative of the Cobb-Douglas function with an expanded specification that takes into account technological changes through an indicator of innovation activity (Figure 4).
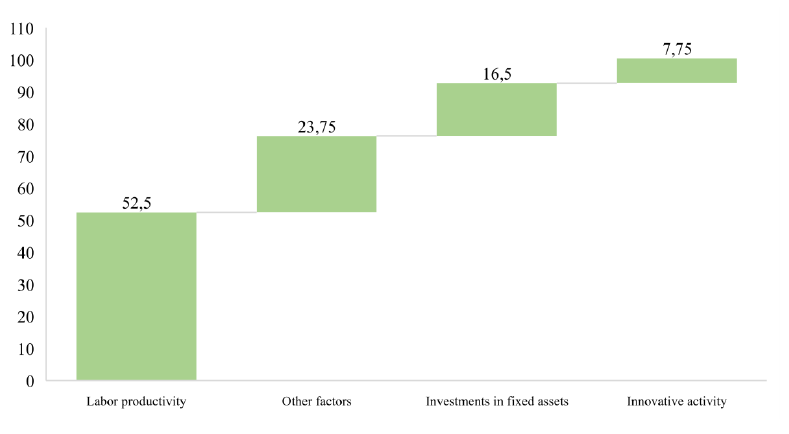
Рис. 4. Распределение вклада факторов в объем отгрузок
в обрабатывающей промышленности
Fig. 4. Distribution of the contribution of factors to the volume of shipments
in the manufacturing industry
The econometric evaluation of the model revealed that all three factors had a statistically significant influence on the performance indicator. Labor productivity makes the greatest contribution to explaining the variation (52.5%), which corresponds to theoretical expectations for labor-intensive industries. Investments in fixed assets account for 16.25% of the variation, reflecting the effect of diminishing returns on investment. Innovation activity makes the smallest contribution (7.5%), while other factors contribute 23.75%, where the amount of raw materials is 35%, logistics is 25%, marketing and sales is 20%, and macroeconomic conditions are 15%. The results obtained indicate the need for an integrated approach to the management of industrial enterprises, combining measures to increase labor productivity, optimize investment activities and stimulate innovation.
The model for the type of activity providing electric energy, gas and steam includes independent variables – investment, productivity and the introduction of digital technologies:

The model shows that each additional million rubles of investment brings 500 thousand rubles of shipment growth. An increase in productivity of 1 kW/person gives an increase in shipments of 800 thousand rubles. The introduction of digital technologies results in an increase in shipments of 12 million rubles, which is the largest contribution due to the synergetic effect. The structure of the investment impact is shown in Figure 5.
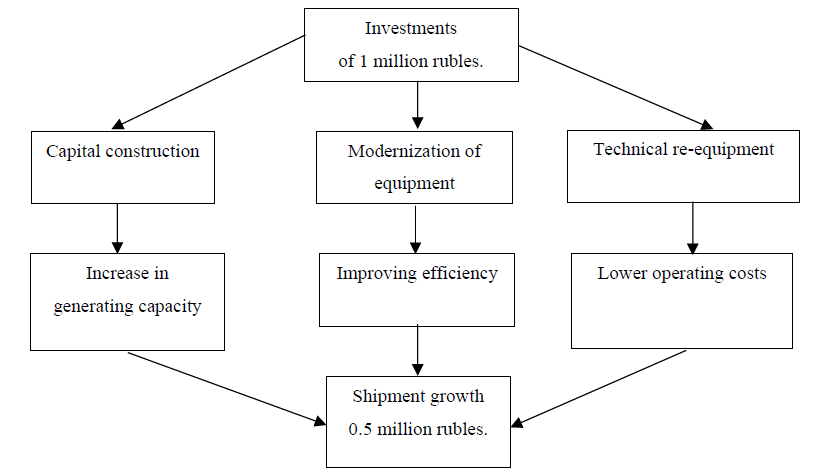
Рис. 5. Трансформация инвестиций в энергетический сектор
Fig. 5. Transformation of investments in the energy sector
The primary allocation of investments at the first level is divided into three key areas, each of which represents a strategic choice of capital use, reflecting the diversification of the investment portfolio [Hajar El Mouttaqui et al., 2024]. The intermediate stage shows an extensive development path (capacity growth), an intensive development path (efficiency improvement) and an optimization development path (cost reduction). The final result shows a synergetic effect, where all three areas complement each other, the final result represents the total effect of various types of investments and a coefficient of 0.5 reflects the overall effectiveness.
Conclusion
The conducted study of the dynamics of shipments by type of economic activity in the Orenburg region for 2020-2023 allows us to formulate the following conclusions: A steady trend towards strengthening the sectoral diversification of the industrial complex of the region has been identified. The developed multifactor models for various types of activities allow us to determine the impact of investment, labor productivity and innovation activity on shipment volumes.
The study identifies the key performance factors of each sector. The models allowed us to build medium-term forecasts with a high degree of reliability, indicating probable stagnation in the extractive sector and steady growth in the manufacturing industry.
Recommendations have been developed for the governing bodies: the development of a differentiated sectoral policy, taking into account the identified imbalances and development trends, stimulating investments in the most effective areas – digitalization of the energy sector and productivity improvement in manufacturing, the development of special support programs for the problematic utility sector in order to prevent further decline, the creation of a monitoring system based on developed models for regular assessment of efficiency measures taken.
The research provides a scientific basis for making managerial decisions and developing a medium-term strategy for the industrial development of the Orenburg region, with the aim of overcoming the identified imbalances and strengthening its competitive advantages.
Thanks
the article was prepared in accordance with the state assignment of the Ministry of Education and Science of the Russian Federation for the Institute of Economics of the Ural Branch of the Russian Academy of Sciences in 2025.


Reference lists